
I’ve looked at hundreds of analytics accounts for schools. Different sizes, different markets, different budgets. But almost every school asks the same question: “Is this working?”

If you’ve asked this, you’re in good company.
From my biased perspective, digital marketing is the #1 question for all schools. Schools want to know if what they’re doing is working. But it’s much harder to get a straight answer to this question than it should be. Why? Because digital marketing is something anyone can make look convincing.
Here is where I will plug our complimentary analytics review. Our team will review your analytics account, tell you what’s working, what’s not, and give you recommendations on how to improve. The best part is you can take those recommendations back to your team or provider and never speak to us again. However, if you’re not interested in filling out our extremely short form for your free analytics review, this is how I’d sanity check your analytics.
Step 1 – How are people actually finding you?
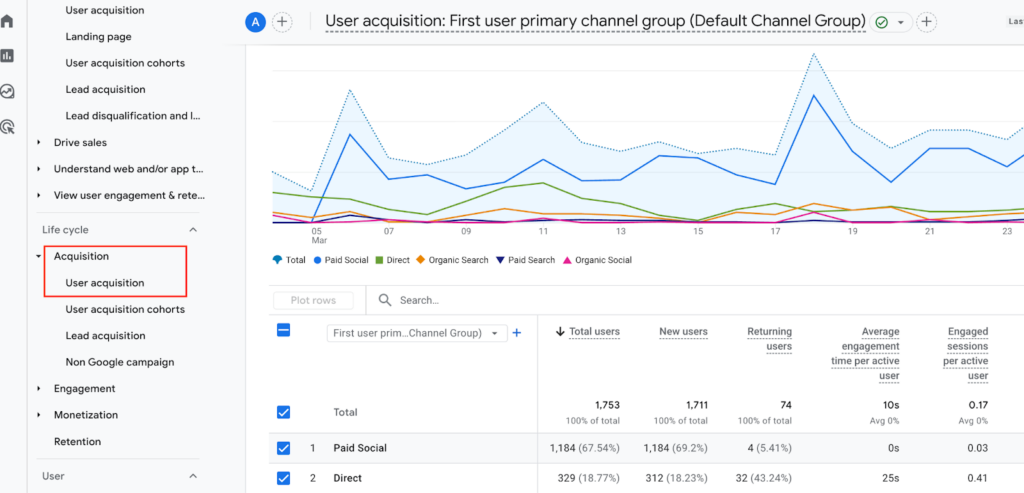
Log into your analytics and click on ‘Reports’ → ‘Acquisition’ → ‘User Acquisition’ (Depending on how your analytics are set up, it may be under “Reports” → “Generate Leads” → “User Acquisition”). This report shows where your traffic comes from and is one of the fastest ways to tell if things are adding up.
For most schools, Organic Search should be your top source of traffic. This shows how many users find you through Google (or Bing!). Next is usually Direct Traffic, i.e. typically users who already know your school and are coming back (think current families). After that, you’ll see a mix of other channels, including paid.
Here’s the important part.
If you’re paying for ads, you should clearly see Paid Search or Paid Social in your traffic sources list. If you don’t, something is off. If those channels do show up, look a level deeper. What’s the percentage of ‘Engaged Sessions’? What about the ‘Average Engagement time per session”? If both those numbers look unusually small, something ain’t working.
This is where I would like to talk about ‘event’ and ‘key event’ data, but GA4 has done such a disservice to these metrics and devalued their relevance, that instead, I’m going to blatantly shill Aryval. Instead of using those two metrics in GA4, our platform can tell you the name of the inquired family, the marketing source they came from, and location data, including zip codes.
Want to see how Aryval works in action? Fill out the form here.
Where are you sending people?
When someone clicks on your ad, what’s the first thing you want them to see?
Is it a blank page with an inquiry form? I hope not. Is it the homepage? Maybe, but with the majority of users on their phone, the homepage can be a bit overwhelming. The answer?
You should send ad traffic to a custom or existing page that introduces your school, showcases engaging photography, highlights upcoming events, and includes a short form to capture interest.
If you want to see the website pages most of your users are visiting, follow these steps: Go back to ‘Reports’ and click ‘Engagement’. Then, select ‘Pages and Screens.’ There should be a mix of ‘admissions’, ‘tuition’, or ‘visit’ pages in your top 10. If you’re only seeing the ‘school calendar’, ‘faculty and staff’, and the ‘parent portal’, then you’re likely wasting advertising budget on current families.
Are you reaching the right families?
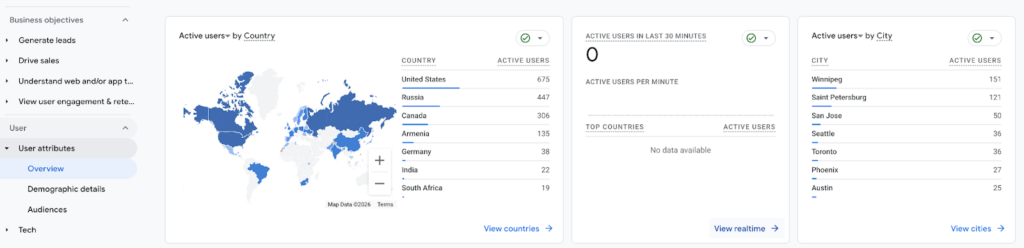
This one is simple. Look at where your users are coming from.
Do your target cities show up? Or are you seeing a spike in traffic from somewhere that’s 100 miles from your school? That’s usually a geo-targeting issue.
Surprisingly common, and yes, it means you’re paying for people who were never going to enroll anyway.
If you only take away one thing
You don’t need to be an expert in analytics. Start with reviewing the above, and then please, ask questions.

If you’re not getting the results you want, ask why. And be direct.
- Which channels are most of our paid traffic coming from?
- What are they doing when they get to our website?
- Are they converting?
- Where are they falling off?
- How can we tell whether this traffic is actually coming from our target audience?
- How much is Aryval, and when can we start?
Everything shows up in the data. It’s just about knowing where to look.